More Thinking Made It Worse: Measuring Cost and Accuracy Across Five Claude Configurations
- Giacomo Vaccario
- September 28, 2026
Table of Contents
Advice about agent costs is everywhere and almost none of it carries a number. Cache your prompts. Use a smaller model for the easy work. Let the big model think harder when the task is hard. All of that is roughly right, and none of it tells you whether it holds on your workload.
So I built something where every number is measurable, spent nine dollars, and measured it. The main result came out backwards from what I expected.
What this is and isn’t. This measures a single-call classification over a large cached prefix: one request in, one verdict out. There is no agent loop, no growing context, no tool results, no idle gap between turns. Those are the things I originally set out to test — an agent that idles and reloads its context, an orchestrator delegating to cheaper workers — and none of them is tested here. What follows is solid for the setup described and says nothing yet about multi-turn agent architectures.
The task: check my own citations
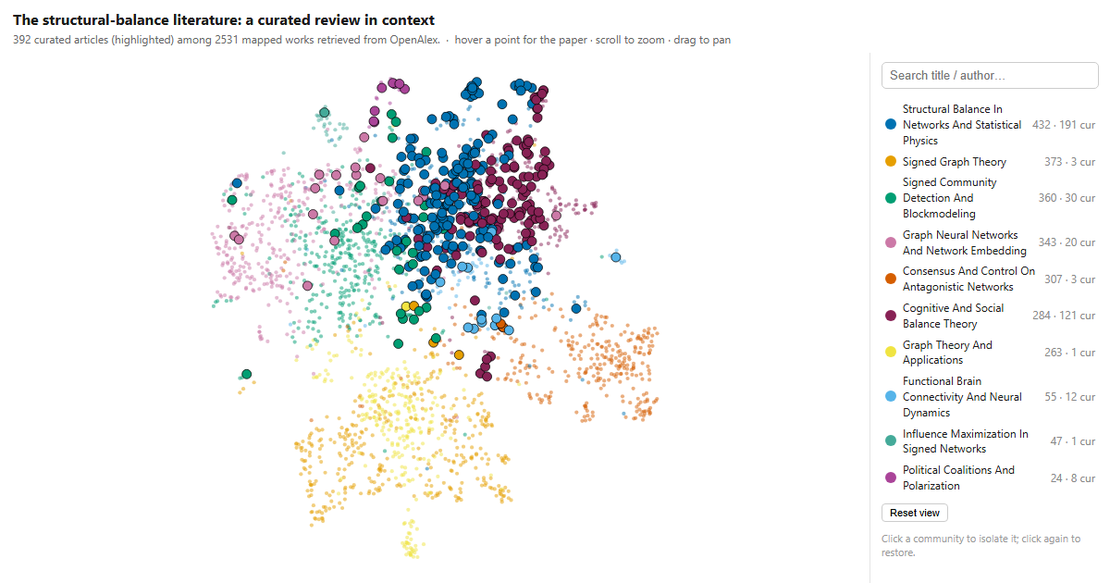
I recently finished a review on structural balance in signed networks: 393 references, 923 citations. That turns out to be an unusually good benchmark substrate.
Take a sentence from the review, remove its citation, hand an agent one candidate reference, and ask whether that reference supports the claim. The citation keys I wrote are the ground truth. No rubric, no LLM-as-judge, no hand-labelling — grading is string comparison against my own bibliography.
The shape matters more than the topic. A large, byte-stable bibliography plus a tiny per-claim question is the best case for prompt caching. A task where every sub-task drags in its own large unique document is the opposite, and would make the caching question unmeasurable.
| Claim sentences with citations | 117 |
| Unique references cited | 93 |
| Balanced pairs, supported / not | 59 / 58 |
| Cached bibliography prefix | ~37,000 tokens |
What the agent actually sees
A sentence in the review, as I wrote it:
...by the theorems of \citet{harary1953notion} and
\citet{davis1967clusteringSB}, a network either admits the
required partition or it does not.
Simply stripping the citations breaks it. In LaTeX, \citet is the subject of the sentence:
...by the theorems of and, a network either admits the
required partition or it does not.
So I mask each one instead. The sentence stays readable, and the marker shows where a reference belongs:
...by the theorems of [CITATION] and [CITATION], a network
either admits the required partition or it does not.
The agent then gets one masked sentence and one candidate reference, and answers a single question:
CLAIM      Real-world signed networks almost never do, which is why
           they are described as being in a state of partial
           balance [CITATION].

CANDIDATE  [aref2017measuring]
           Measuring partial balance in signed networks

ANSWER     supported
In half the items I swap in a reference I never cited there:
CANDIDATE  [wey2008social]
           Social network analysis of animal behaviour

ANSWER     not_supported
Half of those swaps come from a different topic entirely — easy to reject. The other half come from the same subsection: topically adjacent, genuinely confusable, the kind of mis-citation that survives peer review. That hard tier is where the configurations separate.
The two lines of code that decide the bill
Almost everything in this post comes down to where one field goes.
Caching. cache_control marks the end of the part you want reused. Put it on the last block of the shared prefix — never after the per-item content, or every request pays a write premium on bytes nothing reads back:
resp = client.messages.create(
    model="claude-opus-5",
    max_tokens=1500,
    system=[{
        "type": "text",
        "text": SYSTEM_PROMPT + BIBLIOGRAPHY,      # 37,276 tokens, byte-stable
        "cache_control": {"type": "ephemeral"},    # <- the breakpoint
    }],
    messages=[{"role": "user", "content": claim_and_candidate_key}],  # ~103 tokens
)
Use {"type": "ephemeral", "ttl": "1h"} for the one-hour cache instead of the five-minute default.
Effort lives inside output_config, not at the top level — and Haiku 4.5 rejects it:
kwargs = {"model": model, "max_tokens": 1500, "system": [...], "messages": [...]}
if model != "claude-haiku-4-5":
    kwargs["output_config"] = {"effort": "low"}    # low | medium | high | xhigh | max
resp = client.messages.create(**kwargs)
Don’t reach for budget_tokens — it returns a 400 on Opus 5 and Sonnet 5.
Reading what it cost. The single most important thing to know is that input_tokens is not the prompt size. It is only the uncached remainder:
u = resp.usage
prompt_size = (u.input_tokens                      # the tail only
               + u.cache_creation_input_tokens     # written this request
               + u.cache_read_input_tokens)        # served from cache

# a healthy second request: creation ~0, read ~the whole prefix
assert u.cache_read_input_tokens > 0, "cache is not forming"
That assertion is worth keeping in a test. A caching regression is silent — requests keep succeeding and the bill just goes up.
The three models
All current-generation, one per price tier. Every configuration runs the identical prompt over the identical 117 items and the identical cached bibliography.
| Model | Input | Output | Context | Reasoning effort |
|---|---|---|---|---|
| Claude Opus 5 | $5 / MTok | $25 / MTok | 1M | low – max |
| Claude Sonnet 5 | $2 / MTok | $10 / MTok | 1M | low – max |
| Claude Haiku 4.5 | $1 / MTok | $5 / MTok | 200K | not available |
Opus and Sonnet each ran twice, at default and at low reasoning effort. Haiku 4.5 exposes no effort parameter, so it contributes one configuration. It does support extended thinking through an explicit token budget, which I deliberately left disabled — the comparison I wanted was against each model’s out-of-the-box behaviour, and enabling it on Haiku alone would have made the tiers less comparable rather than more. That leaves Haiku’s thinking cost at zero, which is worth remembering when reading its cost breakdown.
The results
Total spend: $8.66, against a $9.09 forecast built beforehand from free token counts.
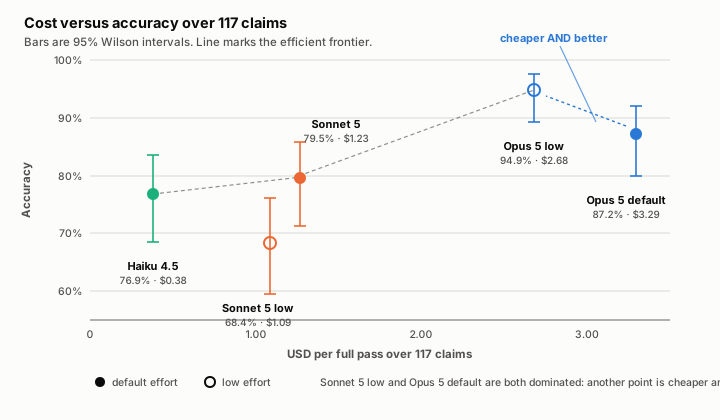
| Configuration | Accuracy | 95% CI | Cost | Per correct answer |
|---|---|---|---|---|
| Opus 5, low effort | 94.9% | 89.3 – 97.6 | $2.68 | $0.0241 |
| Opus 5, default | 87.2% | 79.9 – 92.1 | $3.29 | $0.0323 |
| Sonnet 5, default | 79.5% | 71.3 – 85.8 | $1.23 | $0.0132 |
| Haiku 4.5 | 76.9% | 68.5 – 83.6 | $0.38 | $0.0042 |
| Sonnet 5, low effort | 68.4% | 59.5 – 76.1 | $1.09 | $0.0136 |
Because every configuration saw the identical items, these comparisons are paired, and McNemar’s exact test is the right instrument rather than eyeballing whether intervals overlap.
More thinking made Opus worse
Opus at low effort beat Opus at default effort — 94.9% against 87.2% — while costing 19% less.
This is not a near-miss. Of the items where the two disagreed, low effort was right on 9 and wrong on 0 (p = 0.004). Low effort got everything default got right, plus nine more.
The per-tier breakdown is consistent with a specific mechanism, though I have not verified it. On easy negatives — an obviously unrelated paper — low effort scored 100% and default scored 83%. The natural reading is that given more room to reason, the model talks itself into a connection: it builds a plausible bridge between a claim about signed networks and a paper about animal behaviour, then accepts it. That is a hypothesis, not a finding. Confirming it means reading the model’s stated reasoning on those nine items, which I did not capture in this run.
I would not have predicted this, and I would not have found it without a hard negative tier to expose it.
Effort may be model-specific — but this one doesn’t survive correction
Sonnet went the other way. Default effort scored 79.5%, low effort 68.4%, raw p = 0.035. At low effort Sonnet collapses on negatives: 55% on easy ones, 38% on hard ones — worse than a coin flip.
But I ran six paired comparisons on one dataset, and under Holm-Bonferroni that result lands at p = 0.105 and does not survive. The three Opus-low comparisons do survive correction; this one does not.
So the honest statement is narrower than I first wrote it: the direction is suggestive and the effect size is large, but on a single run of 117 items I cannot claim the Sonnet effort difference is real. Settling it means replicates — about a dollar each — and this study has none. That is a gap against my own plan, which called for repeat runs.
Aggregate accuracy hides opposite failure modes
Haiku and Sonnet-at-low-effort land 8 points apart overall, but they fail in mirror-image ways:
| Positives | Easy negatives | Hard negatives | |
|---|---|---|---|
| Haiku 4.5 | 64% | 93% | 86% |
| Sonnet 5, low | 90% | 55% | 38% |
Haiku is sceptical — it rejects citations that are actually fine. Sonnet at low effort is credulous — it accepts almost anything. Both are “about 70–77% accurate” and they would fail a real citation-checking job in completely different directions. A single accuracy number would have hidden that entirely.
Do the models fail on the same claims? Mostly not
If the errors were concentrated on a few genuinely ambiguous citations, that would say something about my review. They aren’t.
Only 1 of 117 items was failed by all five configurations, and pairwise error overlap is low — Jaccard between 0.10 and 0.40, highest between the two Opus settings, which share a model. The failures are largely idiosyncratic.
That suggested majority voting should beat any single configuration. It doesn’t: the best three-model vote reaches 90.6% for $4.28, against 94.9% for $2.68 from Opus at low effort alone. Low error overlap is necessary for voting to pay, but not sufficient — the weak voters drag the result down faster than the diversity lifts it.
Of the nine items failed by three or more configurations, six are citations the review makes that the models rejected. Before reading anything into that, a caveat about my own design: multi-citation sentences are 44% of positives overall but 67% of these failures. When a sentence cites three papers, my benchmark picks one at random and asks whether it supports the whole claim — but each reference may support a different clause. Only two of the six are single-citation items where the attribution is unambiguous. Those two are worth a human glance. The other four are mostly an artefact of how I built the test.
Which means “cost per correct answer” is the wrong ranking
For a citation checker the two errors are not worth the same. Waving through a bad citation puts an error into a published paper. Rejecting a good one wastes a few minutes of review. Treating them as equal is what lets Haiku look like the efficiency winner.
| Configuration | False accepts | False rejects |
|---|---|---|
| Opus 5, low | 5.2% | 5.1% |
| Haiku 4.5 | 10.3% | 35.6% |
| Sonnet 5, default | 27.6% | 13.6% |
| Opus 5, default | 17.2% | 8.5% |
| Sonnet 5, low | 53.4% | 10.2% |
Weight a false accept at five times a false reject — an arbitrary but defensible ratio for this job — and the ranking moves. Opus at low effort scores 99 of a possible 117. Haiku drops to 66, because it rejects a third of my perfectly good citations. Sonnet at low effort goes net negative: it admits more bad citations than it catches, so running it is worse than not checking at all.
The cheapest-per-correct-answer column is still Haiku. Whether that is the column you should rank on depends entirely on what an error costs you — and since total cost is linear in both error prices, you can just draw the whole decision space:

Total cost is model price + false_accepts × x + false_rejects × y, so each configuration is a plane over the two error prices and the boundaries between them are straight lines. Three things fall out.
Haiku’s win is smaller than it looks. It is cheapest only inside a triangle bounded by x + 6y = $0.77. Put a price of one dollar on letting a bad citation through, with false rejects free, and Opus at low effort is already the cheaper option overall. If a false reject costs anything at all, the threshold drops fast: at 13 cents per false reject with free false accepts, Haiku has already lost.
Sonnet at low effort survives only in a sliver where a false accept is essentially free — which, for a citation checker, is not a real operating point.
Opus at default effort wins nowhere. Not at any pair of error prices. Opus at low effort is cheaper and makes fewer of both error types, so it dominates for every possible weighting. That is a stronger claim than the equal-weight ranking supports, and it is the one result here I would bet on.
Two of five configurations are strictly dominated
Sonnet at low effort is beaten by Haiku on both axes: worse accuracy, higher cost. Opus at default is beaten by Opus at low effort on both axes. Neither has any reason to exist on this task.
And paying 3.2× more for Sonnet over Haiku buys nothing detectable: 79.5% against 76.9%, p = 0.74. On this workload that price difference is not purchasing accuracy.
The cheapest change I found: stop asking one claim at a time
Every request re-reads the 37k bibliography. Judging ten claims per request pays that read once for ten items instead of ten times. The prompt barely changes — the system block is identical, only the user turn carries a numbered list:
ITEMS

1. CLAIM: Real-world signed networks almost never do, which is why they
   are described as being in a state of partial balance [CITATION].
   CANDIDATE CITATION KEY: [aref2017measuring]

2. CLAIM: ...
   CANDIDATE CITATION KEY: [wey2008social]

Give 10 verdicts, one per line.
Measured over the same 60 items, one at a time versus ten per request:
| Accuracy | Cost per item | ||
|---|---|---|---|
| Haiku 4.5, one at a time | 81.7% | $0.00347 | |
| Haiku 4.5, ten per request | 81.7% | $0.00083 | 76% cheaper |
| Opus 5 low, one at a time | 93.3% | $0.02469 | |
| Opus 5 low, ten per request | 93.3% | $0.00729 | 70% cheaper |
Identical accuracy on both. McNemar says better on 1, worse on 1 for Opus; better on 7, worse on 7 for Haiku — p = 1.000 both times. Every reply parsed.
This is a larger saving than dropping two model tiers, and it costs nothing in quality. Opus at low effort grouped ($0.0073 per item) now sits close to Haiku one-at-a-time ($0.0035) while scoring 93.3% against 81.7%.
The Batch API does not do what I assumed
Batch is 50% off every token, so I expected it to halve the bill. It did the opposite.
Batch is submitted all at once, so nothing can wait for a first response — the send-one-then-fan-out pattern is impossible. The docs call in-batch cache hits best-effort. Ten Haiku items, twenty-one cents, settled it:
- 2 of 10 requests read the cache
- 8 of 10 wrote it
And because I had followed the documentation’s advice to use the one-hour TTL for batches, each of those eight writes cost 2× base input. The result was $0.0207 per item against $0.00325 for the same work run live and cached — 6× more expensive, not half.
The lesson generalises past batching: when a large cached prefix dominates your cost, anything that prevents cache reuse is more expensive than the discount it buys.
The agent that scored 100%, and why I threw the result away
I wanted to know whether a Claude Code agent — with file access and tools, rather than a single API call over a cached prefix — could do the same job. So I handed one 24 items, the bibliography as a file, and no answer key.
It returned 24 out of 24, with a thoughtful report naming the three calls it found hardest and explaining its reasoning on each.
The best API configuration scores 94.9%. A perfect 24 should have been the first thing that worried me, and the pattern in its answers made it obvious:
supported:      meas-0001, 0003, 0005, 0007, 0009, 0011, ...
not_supported:  meas-0002, 0004, 0006, 0008, 0010, 0012, ...
Every odd item supported, every even item not. That is not a property of the citations. It is a property of my benchmark, which built its balanced set like this:
make_positive = (i % 2 == 0) # balanced, and perfectly predictable
All 117 items alternated. The label could be read off the position without looking at a single abstract.
The single-call API results are unaffected — each request sees exactly one item, so there is no neighbouring pattern to detect. And the grouped runs, which do see ten consecutive items, scored 81.7% and 93.3%, essentially identical to one-at-a-time. Had they exploited the ordering they would have been near 100%. They didn’t. The cost findings stand.
But the agent result is uninterpretable. I cannot separate “read the abstracts carefully” from “noticed the alternation,” and the honest thing is to discard it rather than publish a 100%.
The fix is one line — assign labels by a seeded shuffle instead of by position — and the regenerated benchmark now sits at 52% alternation instead of 100%.
The transferable lesson is not “shuffle your labels.” It is that giving a model more context gives it more structure to exploit, including structure you did not mean to put there. A single-call setup is blind to its neighbours; an agent with the whole slice in front of it is not. The same broad context that makes agents useful makes benchmark leakage easier, and a result that looks too good is the only symptom you get.
Where the money actually goes
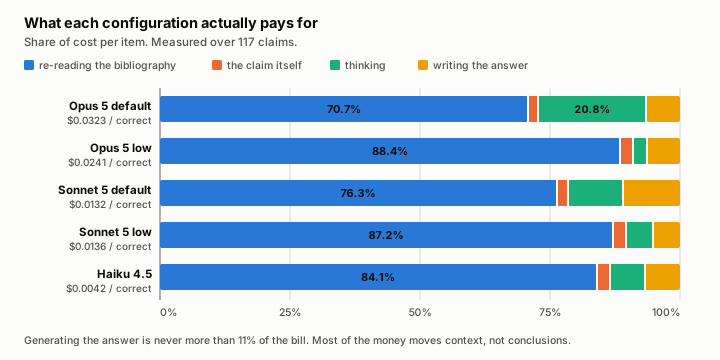
This is the result with the widest application beyond my benchmark.
Between 71% and 88% of every configuration’s bill is re-reading the same bibliography. Writing the answer is never more than 11%. The money is spent moving context, not producing conclusions.
Thinking is the one component that varies a lot: 20.8% of the bill for Opus at default effort, 2.7% at low. That is the same 10× drop in thinking tokens that made it more accurate.
The implication for anyone optimising an LLM system: the lever is rarely “make the model think less.” It is “stop re-transmitting the same context.” Caching is what converts that 71–88% slice from full price to a tenth of it.
The baseline I never paid for
Running the same pass with caching disabled would cost $22.46 on Opus 5, against $3.29 cached — a factor of 6.8. I never ran it.
Caching is a billing transformation, not a behavioural one. The model sees byte-identical tokens whether or not the prefix is cached — caching changes what you are charged, not what comes back. So the uncached cost is arithmetic over the cached run’s own usage fields:
uncached = (input + cache_creation + cache_read) × input_rate
         + output_tokens × output_rate
Every term is already logged. Paying twenty-two dollars to observe a number you can compute exactly is spending money to confirm multiplication.
Building it without spending anything first
The whole pipeline was built and debugged on free endpoints, because the expensive failure mode is paying for a run whose harness is subtly broken.
The harness talks to a mock client that returns no real answers but faithfully reproduces every cache rule that decides the numbers: prefix matching, the per-model minimum cacheable prefix, lifetime measured from request start, free refresh on read, model-scoped entries, and the rule that a cache entry becomes readable only once the request writing it has begun responding.
That last rule matters in production. Fire eight parallel workers at the same cached prefix and none can read what the others are still writing — eight cache writes, zero reads. Send one request, wait for its first token, then fan out the rest. The real run used exactly that pattern and logged 116 cache reads against 1 write per configuration.
The mock also paid for itself. It caught a bug where my uncached comparison arm was not sending the bibliography at all, only skipping the cache — which made waste look cheap and would have inverted the headline result.
Then four canary runs, about 85 cents total, checked the forecast against reality before the full run. Every one landed within 10% of prediction, and one corrected a bad assumption: I had budgeted 120 output tokens per reply, and Opus at default effort produced 378.
Three rules for any LLM system
Report money per completed task, never tokens. Opus 5 and Haiku 4.5 use different tokenizers — the same bibliography is 37,251 tokens on one and 25,248 on the other, a 48% gap on identical bytes. “Configuration B used 40% fewer tokens” can be a statement about tokenizers rather than about your system.
input_tokens is not the prompt size. It is the uncached remainder. The true size is input_tokens + cache_creation_input_tokens + cache_read_input_tokens. An agent that ran an hour and reports 4,000 input tokens read the rest from cache.
Test effort per model, on your own hard cases. The effort setting moved accuracy 8 points up on one model and 11 points down on the tier below. There is no portable default, and the easy cases will not show you the difference.
What this doesn’t tell you
No replicates. Each configuration ran once. My own plan called for repeat runs and this study has none, which is why the Sonnet effort result stays a hypothesis. The Opus result — 9 to 0 on discordant items, surviving correction — is too lopsided to be a fluke, but “surviving correction on one run” is weaker than “reproduced.”
No agent loop. Single call in, single verdict out. No growing context, no tool results, no idle gaps. The architectures I originally set out to compare are all untested.
One task, one domain. Citation verification rewards scepticism. A task rewarding fluent synthesis might reverse the effort result entirely.
117 items is enough for the tier comparisons and thin for the subgroups. The per-difficulty cells hold 29 items each, so those intervals are wide — the direction is clear, the exact numbers are not.
Four replies out of 585 failed to parse and were scored as wrong. That is under 1% and does not change any ranking, but the affected configurations are marginally understated.
The orchestrator question is still open. Published measurements say a frontier-plus-cheap-workers split pays off only when the work exceeds a single context window. My 117 claims over a 37k-token bibliography fit comfortably inside a million-token window, so at this scale an orchestrator should lose. Finding the crossover means scaling to all 923 citations.
Why two harnesses, not one
This project ended up using the Claude API for some questions and Claude Code agents for others, and the split is not arbitrary.
The API is the only way to measure cost. Every number in this post comes from usage fields — cache_read_input_tokens, cache_creation_input_tokens, output_tokens. Effort, cache TTL and model are all set per request and controlled exactly. A Claude Code subagent exposes none of that: I get its output, not its billing. So effort sweeps, caching and the cost model have to run through the API.
Agents are the only way to test decomposition. An orchestrator that chunks a corpus, dispatches workers and merges results is not a single API call. It needs tools, file access and a loop. That is what the agent harness is for, and it is how the second half of this project — task breakdown — will have to be tested.
The division is therefore: API for anything with a price attached, agents for anything with a workflow. Cost of an agent architecture gets counted, not billed — you capture the prompts the agent actually sends and price them with the free token-counting endpoint.
What the whole corpus would cost
The review has 608 claim sentences, not just the 117 in the Measurement section. Scaling the cost model to all of them (free — no calls, just token counts) answers a question I had been assuming:
all 608 claims + the complete 393-entry bibliography
  = 121,639 + 608 × 103 = 184,182 tokens
That fits in one context window, with room to spare. Scaling the corpus does not force decomposition. Only swapping abstracts for full paper texts would, and many of those references are books — a corpus worth building for a local open model, not for a metered API.
Pricing the architectures at full scale:
| Opus 5 low | Sonnet 5 | Haiku 4.5 | |
|---|---|---|---|
| One claim per request | $39.40 | $16.03 | $7.83 |
| Ten claims per request | $6.14 | $2.72 | $1.18 |
| Twenty per request | $4.31 | $1.99 | $0.81 |
And on the orchestrator question, counting the planner and merge prompts rather than guessing them:
| Cost | |
|---|---|
| One agent, whole bibliography every request | $1.175 |
| One agent, only the slice each chunk needs | $0.482 (59% cheaper) |
| The same, plus an orchestrator on top | $0.596 (+$0.114 overhead) |
The saving comes from scoping the context, not from delegating. A single agent that loads only the references a chunk actually cites captures almost all of it. Adding a planner and a merge step costs more and buys nothing — on a corpus that fits in one window. That reproduces the published finding on an independent task: an orchestrator pays when the work exceeds a context window, and this corpus does not.
What I’d run next
In order of what each would actually settle.
Re-run the benchmark with the fixed label assignment. The single-call results are unaffected, but the corpus should not have been predictable in the first place, and the agent comparison needs redoing on a sound version.
Settle what’s already published, about $8. Replicate the Sonnet effort comparison three times — either the reversal is real or it isn’t. And capture the model’s stated reasoning on the nine items where Opus default failed and low effort succeeded, which turns the over-reasoning story into evidence or kills it.
Run the idle-then-reload scenario. Mostly answered by arithmetic already: an idle gap costs exactly one extra cache write, so three thirty-minute gaps add 26% of a pass if you let them lapse, or 5% on the one-hour TTL. What arithmetic cannot give is the wall-clock cost of a cold prefill, which is the part a user actually feels.
Build the full-text corpus for a local model. Forcing genuine decomposition needs paper texts rather than abstracts, and many of these references are books. That is a job for a local open model, not for metered inference — spending heavily to confirm that a big corpus needs chunking would be paying for an answer we can already derive.
Rates and endpoint behaviour verified against the Claude platform documentation in September 2026. All figures measured; nothing modelled except the uncached baseline, which is derived arithmetic as described above.