A Curated Review in Context: An Interactive Knowledge Map of the Structural-Balance Literature
- Giacomo Vaccario , Piotr Górski , Georges Anders , Manuel S. Mariani , Janusz Hołyst
- September 7, 2026
Table of Contents
When you write a review, one question follows you around: did you cover everything? For an interpretive, physics-oriented review of structural balance the honest answer is “no, on purpose”. The reference list is a curated selection of the work that matters conceptually, not a systematic harvest of every paper that mentions a signed network. The map below is an attempt to show that rather than assert it.
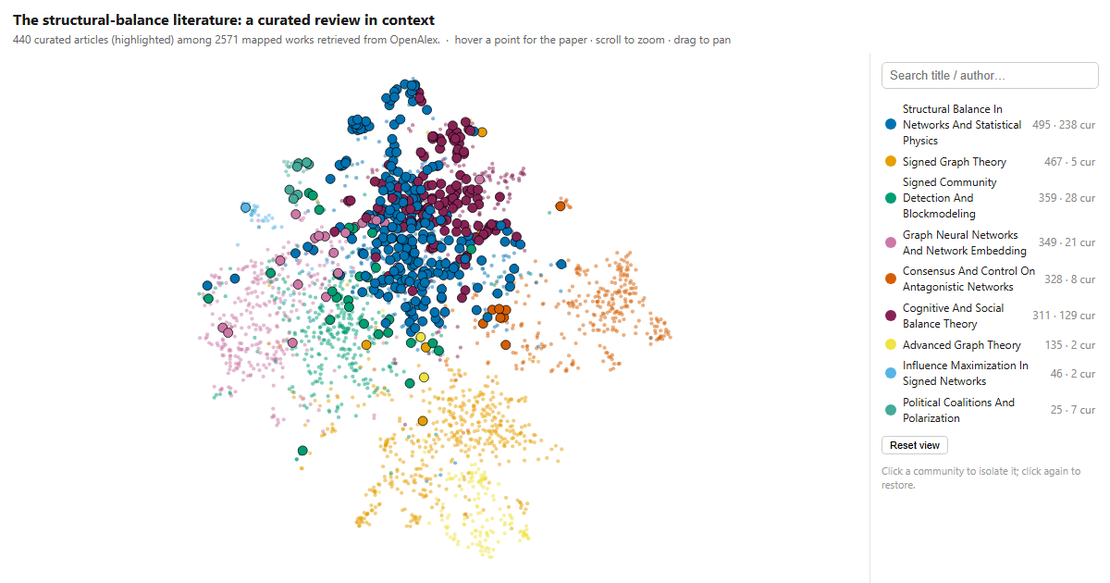
What you are looking at
Every dot is a publication retrieved from OpenAlex. The large outlined markers are the 440 references cited in our review; the small faint dots are a background of ~2,130 works pulled with the phrases structural balance, signed network, signed graph, signed social network and Heider balance. A background work is kept only if its title or abstract carries an explicit signed-network or balance term. Because “structural balance” also means the cyclically-adjusted budget balance in macroeconomics (learned about this only after the map was built!) and there is “work–life balance”, “balance of nature”,etc. The ambiguous phrases only count when a signed-network term appears within a few words of them. That filter removes roughly 600 fiscal-policy and other off-topic papers.
Colours are communities; the panel on the right names them and gives their size and how many curated papers fall inside each. The curated set piles up in the two largest communities — the statistical physics of balance and cognitive and social balance theory (367 of 440 references). It only touches topics such as signed graph theory, signed graph neural networks, link-sign prediction, and consensus and distributed control on antagonistic networks.
Hover a point for the paper (title, authors, year, community, citations). Scroll to zoom, drag to pan, type in the search box to spotlight titles or authors, and click a community in the legend to isolate it. Open full screen ↗
How the map is built
The pipeline is a laptop-sized adaptation of the “science map” method developed at the Max Planck Institute for Human Development (Thoma et al. 2025).
- Corpus. Resolve every
.bibentry on OpenAlex (DOI, then a verified title search where the candidate has to actually match on title and year, then a fuzzy match against the corpus), then union a focused phrase search for the background layer, filtered as described above. Abstracts come from OpenAlex’s inverted index, with the.bibentry as a fallback where OpenAlex has none. A handful of pre-1970 references that OpenAlex does not index (Lenz 1920, Newcomb 1968, Sampson’s 1968 monastery study) are added by hand. - Representation. Each work becomes the concatenation of three
L2-normalised spaces: a sentence embedding of title + abstract
(
all-MiniLM-L6-v2), a co-authorship embedding (PPMI + truncated SVD of the work×author matrix), and a bibliographic-coupling embedding (same construction on shared references). - Layout & communities. UMAP to two dimensions, Leiden for communities, each labelled by its dominant OpenAlex research topics, with a keyword (c-TF-IDF) fallback and a few labels set by hand.
- Render. A static figure for the paper and this interactive version for the web. Community colours are assigned by size, so they stay put when the corpus is refreshed.
The interactive map is a single self-contained HTML file: no JavaScript
libraries, no network calls, the ~2,500 points embedded as JSON and drawn on a
<canvas>.
Reading it as a statement of scope
Re-clustered on their own, the curated papers split into recognisable sub-themes: cognitive balance and belief dynamics, signed social-network analysis, Hamiltonian and statistical-physics models, international relations and economics, ecological systems, higher-order balance. This is roughly the table of contents of the review. The big map is the counterpart: it says where that curated core sits in the wider signed-network landscape, and where it deliberately does not go.
Reference
The method this map adapts:
@article{thoma2025mapping,
  title     = {Mapping the landscape of behavioral reinforcement learning research},
  author    = {Thoma, Anna and Bolenz, Florian and Tiede, Kevin and Yang, Yujia
               and Palminteri, Stefano and Hertwig, Ralph and Wulff, Dirk},
  year      = {2025},
  publisher = {OSF},
  doi       = {10.31234/osf.io/6c2va_v2},
  url       = {https://doi.org/10.31234/osf.io/6c2va_v2}
}